- November 30, 2017
- Posted by: Dave Kurlan
- Category: Understanding the Sales Force
If you have a role in sales or sales leadership then what could be better than knowing exactly how you and/or your salespeople REALLY compare with the other salespeople in your industry or in the world? Could anything be more fascinating than a visual or infographic depicting how effective your sales force is at various aspects of selling? And what if these visuals could demonstrate that B2B salespeople create and send more than 16,000 inappropriately timed proposals each day? Cool, huh? More on that data in a minute.
Earlier this year we introduced a free public site where you could actually see how your salespeople compared in each of the 21 Sales Core Competencies. Recently, we improved the site so that in addition to average scores and comparisons in each competency, you can see the percentage of salespeople that have each competency as a strength. Check it out here!
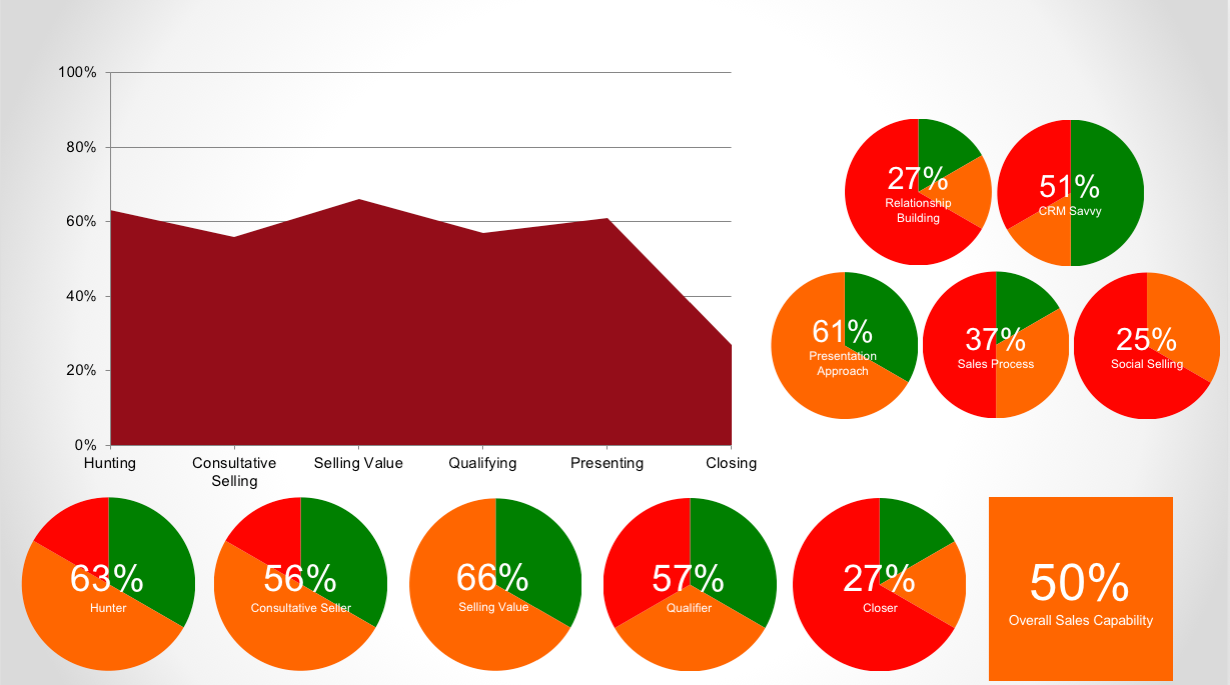
I love some of the new infographics we have developed to show clients the capabilities of their sales force. For example, check out this slide that visually tells the story of how their sales force sells. The number in each pie chart is the average score in each competency and the colors indicate the percentage of salespeople that have that competency as a strength, weakness or in between. For example, the highest average score for this sales force is for the value seller competency but only 1/3 of the sales force has value seller as a strength.
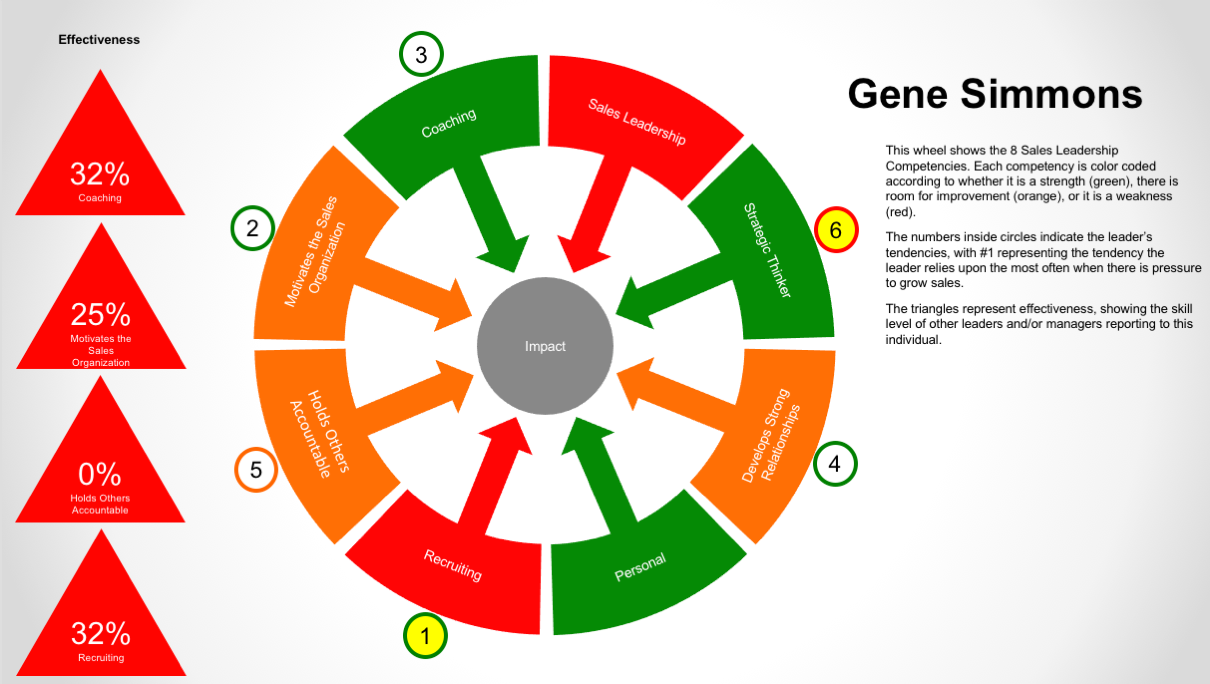
This is a cool slide. It shows the 8 sales leadership competencies that we measure in the outer ring and his tendency by rank outside the ring. When a tendency is not aligned with a strength we have a problem. For example, in this slide, strategic thinking is green – a strength – but strategy is ranked 6th out of 8 as a tendency and recruiting – a weakness – is ranked 1st out of 8 in his tendencies. Those are both problems! Gene should be spending much more time on strategy and much less time on recruiting.
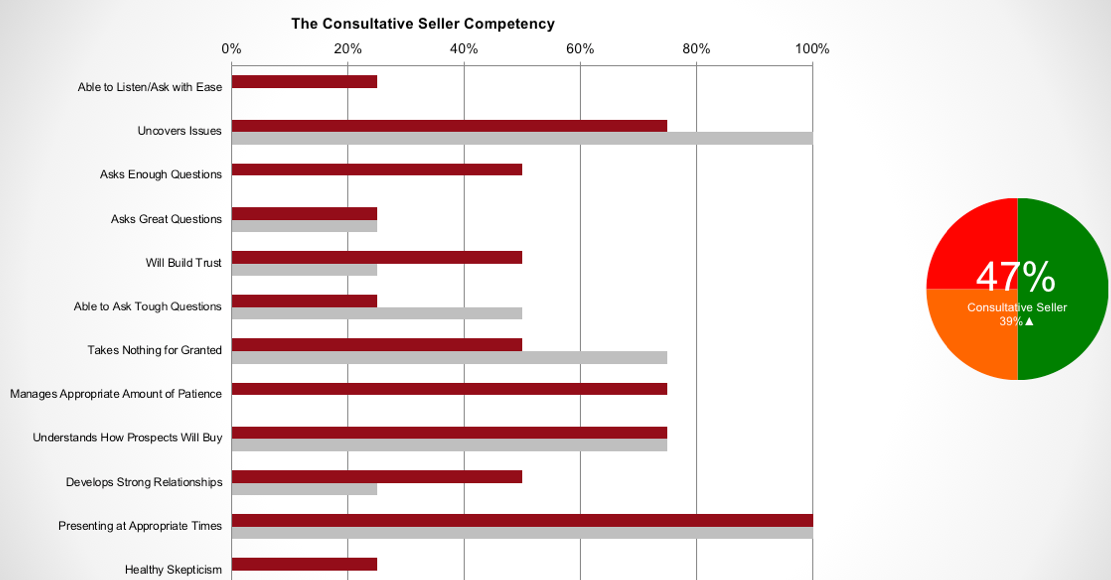
We reevaluate a sales team after a year or so and this is how we show the change in a particular competency. In this slide the average score increased from 39 to 47 in the Consultative Competency and there were improvements in most of the attributes and half of the salespeople now had this competency as a strength.
My favorite slide is the one where we restage the company’s pipeline according to what’s real. In the slide below, we looked at 717 late stage proposal ready opportunities. If they were all truly late stage, the visual would have looked like the umbrella stand in the middle image. However, our analysis caused 36% of the opportunities to move back to the suspect stage and 33% of the opportunities back to the prospect stage. Only 27% were actually closable and another 4% were qualified. This company prematurely sent 494 unqualified proposals!
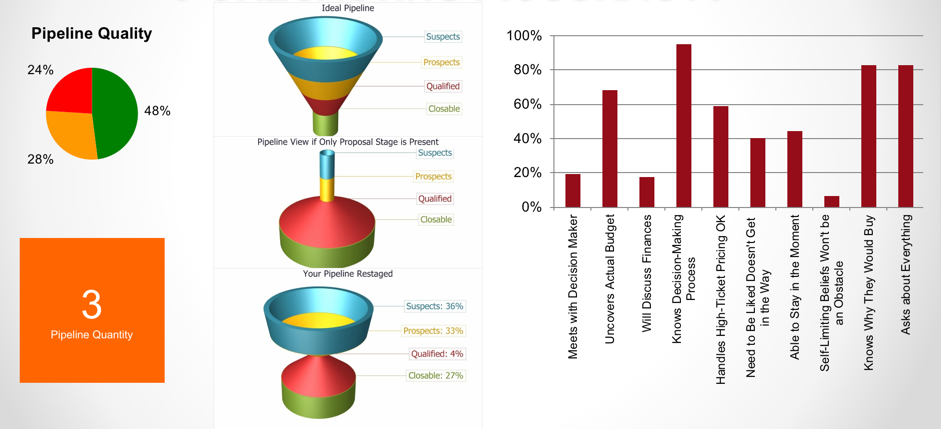
This company is not unusual. If their 239 salespeople produced 494 unqualified proposals, then how many inappropriately timed proposals do 4.5 million B2B salespeople produce? A little more half are in inside sales roles that handle the top of the funnel. That leaves around 2 million B2B salespeople who are making 4,133,891 premature unqualified proposals per year or 16,535 per day!
We have around 50 more infographics like these that help to visually show how well equipped a sales force is to compete, win more business and grow revenue. We identify all of the gaps and issues to be addressed and recommend a plan of action to accelerate sales effectiveness.
Most importantly, we provide answers to the questions that companies cannot answer on their own. If this interests you, excites you or is something you want us to do at your company, just email me and I’ll forward it to the appropriate person.
Image Copyright iStock
