- July 13, 2021
- Posted by: Dave Kurlan
- Category: Understanding the Sales Force

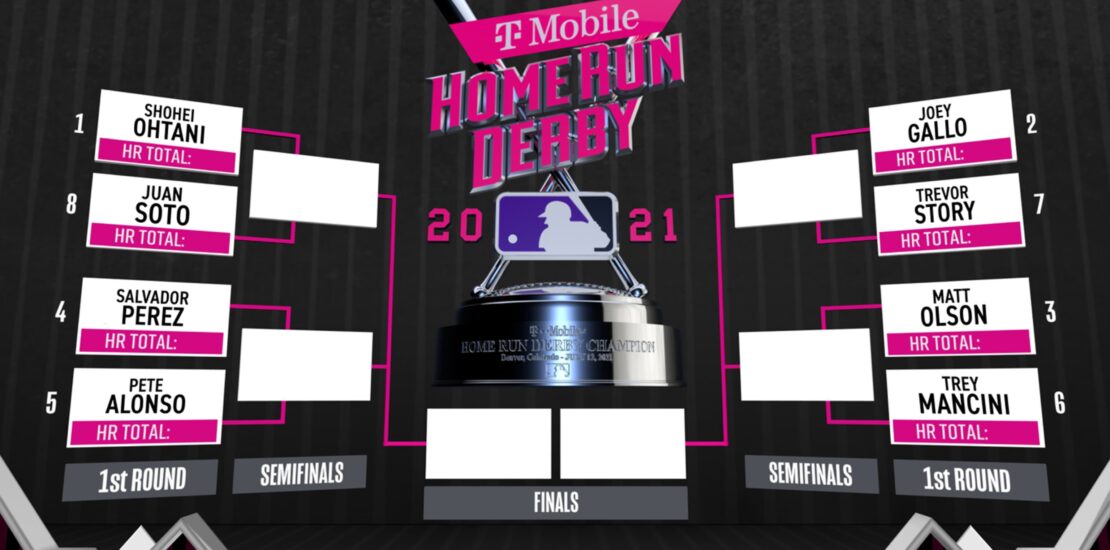
Last night Major League Baseball held its annual Home Run Derby. We’ve seen the home run derbies before. We watch them every year. They are always the same – each slugger tries to hit more home runs than the other sluggers in the contest. At the same time, they are always different and last night there were four stories that made this year’s home run derby different from all the rest. Pete Alonso, Shohei Ohtani, Trey Mancini, and Juan Soto made the contest different. It is always the individual story lines that make the mundane different.
Speaking of the same but different, from time to time I’ve posted some compelling top/bottom sales team analyses using sales assessment data from Objective Management Group (OMG). From nearly 250 data points in 21 Sales Core Competencies, we identify the specific findings and scores that differentiate a company’s top 3 performers from their bottom 3 non-performers.
There are several reasons for doing this:
- Proof of Concept – to prove to non-believers that OMG can clearly differentiate between their tops and bottoms and would therefore be able to identify sales candidates who will succeed in their business.
- Tailored Fit – we add those same differentiators to role configurations as additional customization and criteria on their OMG sales candidate assessments.
- Understanding – it helps clients to know why some salespeople are succeeding and others are failing. These differentiators help them understand their sales teams, salespeople and sales bottlenecks.
I completed a top/bottom analysis for a large, well-known company and it doesn’t get more compelling than this:

In this analysis there were 38 findings and scores that differentiated the tops from the bottoms. The three tops met between 89%-97% of them while the three bottoms met only 5%-13% of them. But the analysis is bigger than how many differentiating factors there are and how the final percentages are different. Look at some of the differences within the findings themselves!
The tops are 100% more effective at reaching decision makers which, by itself, is a game changer.
The tops are 266% more effective at using a consultative approach to selling and 193% more effective at selling value. Of course they are!
The tops are 187% more compatible with the criteria for being successful in their roles which points to very ineffective sales selection at hiring time. For example, in the screen shot above you can see that the tops, but not the bottoms, are generally more experienced and comfortable with hunting for business in the C Suite of institutional accounts. They are also more experienced and comfortable facing resistance and competition, asking for more than $250,000 in a long sales cycle, and selling conceptual services. Together, those are ten factors that should have been identified as crucial for sales success PRIOR to hiring any salespeople, and their candidates should have been vetted for those experiences and their comfort level!
Want to hit more home runs when you’re hiring salespeople? Never will you have more confidence hiring the right salespeople for your company and selling role(s) than when you use Objective Management Group’s (OMG) Sales Candidate Assessments. They are proven and time-tested to be the most accurate and predictive sales-specific assessment on planet Earth. Check them out here.
Image copyright MLB.
