- January 20, 2023
- Posted by: Dave Kurlan
- Category: Understanding the Sales Force

You’re not supposed to mix alcohol and medication, which isn’t an issue for me because I don’t drink and I avoid medication. But those aren’t the only two things you’re not supposed to mix. You’re not supposed to use mixed metaphors either so I am breaking the rule, incorporating 4 separate analogies, and then attempting to string them together at the end.
When I’m driving, I usually fire up Spotify and listen to one of my playlists but for some reason, last week I chose to play songs by the 70’s band, The Raspberries. I like three of their songs a lot but lacked familiarity with the other songs on their four albums. I figured that there had to be some other good tracks to discover. Wrong. The Raspberries just do not compare to some of the great talents from their era. The Beatles, The Beach Boys, Chicago, Earth, Wind and Fire, and solo artists like Elton John, Billy Joel, Michael Jackson or Lionel Richie routinely produced albums on which every song could have been or was a hit single. [Note: It seems like all you needed to be a star in the 70’s and 80’s were two first names and not just the four I named, but also consider Huey Lewis, Carly Simon, Paul Simon, Rod Stewart, George Harrison, and James Taylor!] The comparison of successful hit-makers to common musicians are analogous to sales pipelines where top salespeople have a never-ending flow of good, strong, qualified opportunities and weak salespeople have fewer opportunities and most of them aren’t very well qualified.
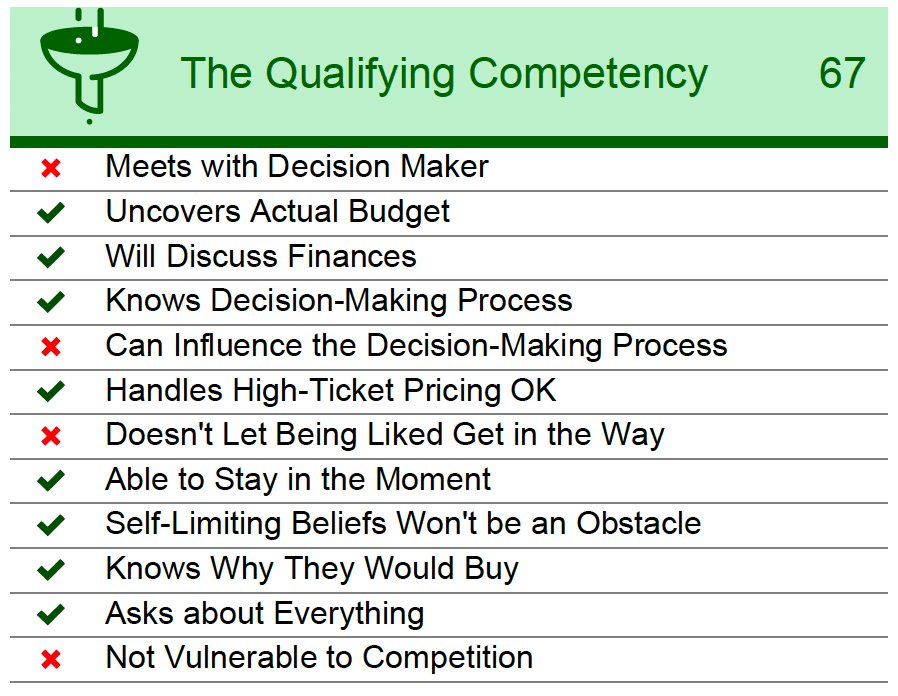
If we look into some of Objective Management Group’s (OMG) data from the assessments of 2,296,264 salespeople, we see the following as it relates to the Qualifier competency and its 12 attributes:


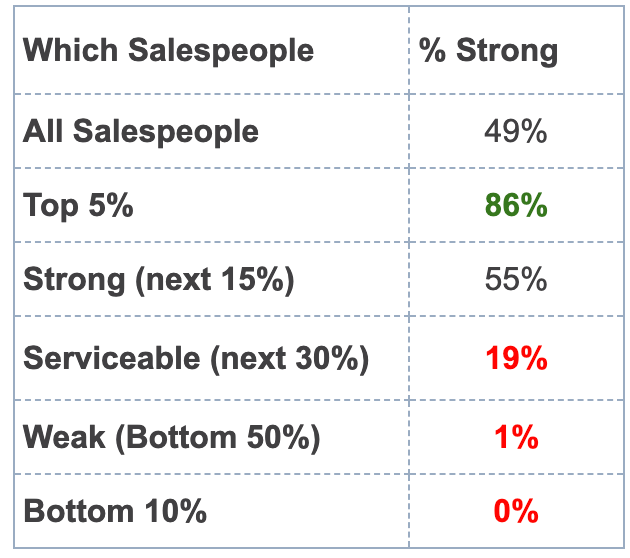
As you can see from the table above right, the top 5% of all salespeople are 56% stronger at qualifying than strong salespeople, 452% stronger than serviceable salespeople, and 8600% stronger than the bottom 50%. 8600% Stronger!!!! Who says qualifying isn’t important? See how your industry/salespeople compare.
We were first-time diners at Friendly Toast, an all-day brunch restaurant in the Boston area. Unfortunately, my inner 12-year-old ordered and because of my inability to control him, I was ecstatic over my hot chocolate peppermint waffles! My reaction was consistent with a sales opportunity where the salesperson receives a very strong introduction from a happy customer, the large opportunity was completely teed up, the sales cycle was short, sweet, and easy, and the deal closed without competition. How many salespeople EVER get to experience that kind of easy? According to OMG’s data, only 3% of all salespeople have a steady flow of quality introductions and referrals and for weak salespeople, it’s half that.
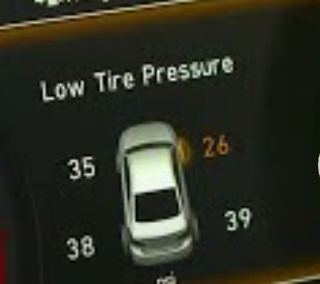
One of the dashboard displays in my car shows the pressure for all four tires.

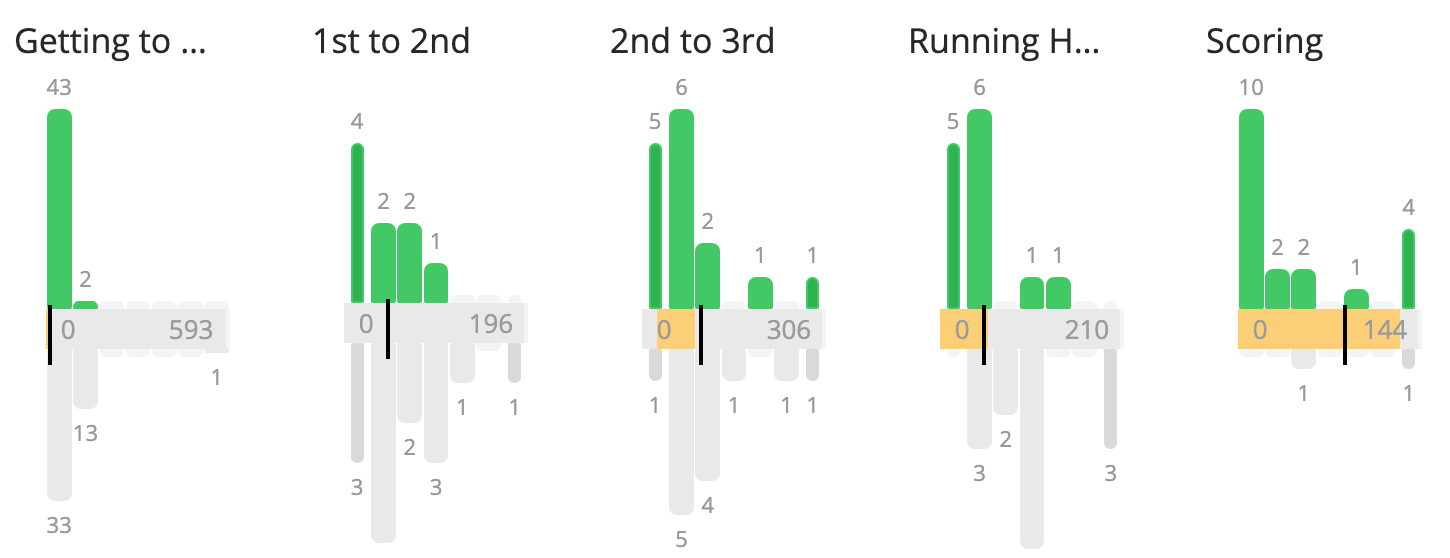
When a tire begins to lose pressure the early warning system is incredibly helpful. Membrain is the CRM application that we most frequently recommend to clients, and our clients LOVE, LOVE, LOVE Membrain compared to Salesforce dot com. Membrain comes with a win/loss analysis consisting of more than a dozen criteria. While they won’t all have significance, most of them do. The four analyses that I believe are most analogous to the tire pressure warning are:
Age, Time in Stage, Stalled and Time Spent.

The taller green bars in the Time in Stage image shows that the largest percentage of deals won remain in each stage for only a day or two while the odds for closing deals that remain in stages for more than a week are not good.
Time Spent (not shown) shows that an average of 1 hour and 9 minutes is spent working in Membrain on deals that are won, but an average of only 9 minutes is spent on deals that are later archived.

The Stalled image above shows that the average time stalled on a won deal is 43 days compared with 110 days for an archived deal.
And finally, the Age finding (not shown) tells us that the average age of a won deal is 39 days, compared with 105 days for an archived deal.
Together, these four components of the win/loss analysis show that when deals are stalling, we don’t spend time working on them, and the chances of closing them are in direct disproportion to how long they stall. It’s our version of the tire pressure display!
What do these four analyses have to do with qualifying? The more thoroughly qualified the opportunity, the less likely it is to stall for long, and the more likely it is that you can either lose fast – a good outcome – or win fast – a better outcome!
So whether it’s mixing drugs and alcohol, scoring a prolific number of hit songs, eating an awesome meal, or a dashboard warning indicator, they all tie back to the importance of thoroughly qualifying opportunities and winning deals.
